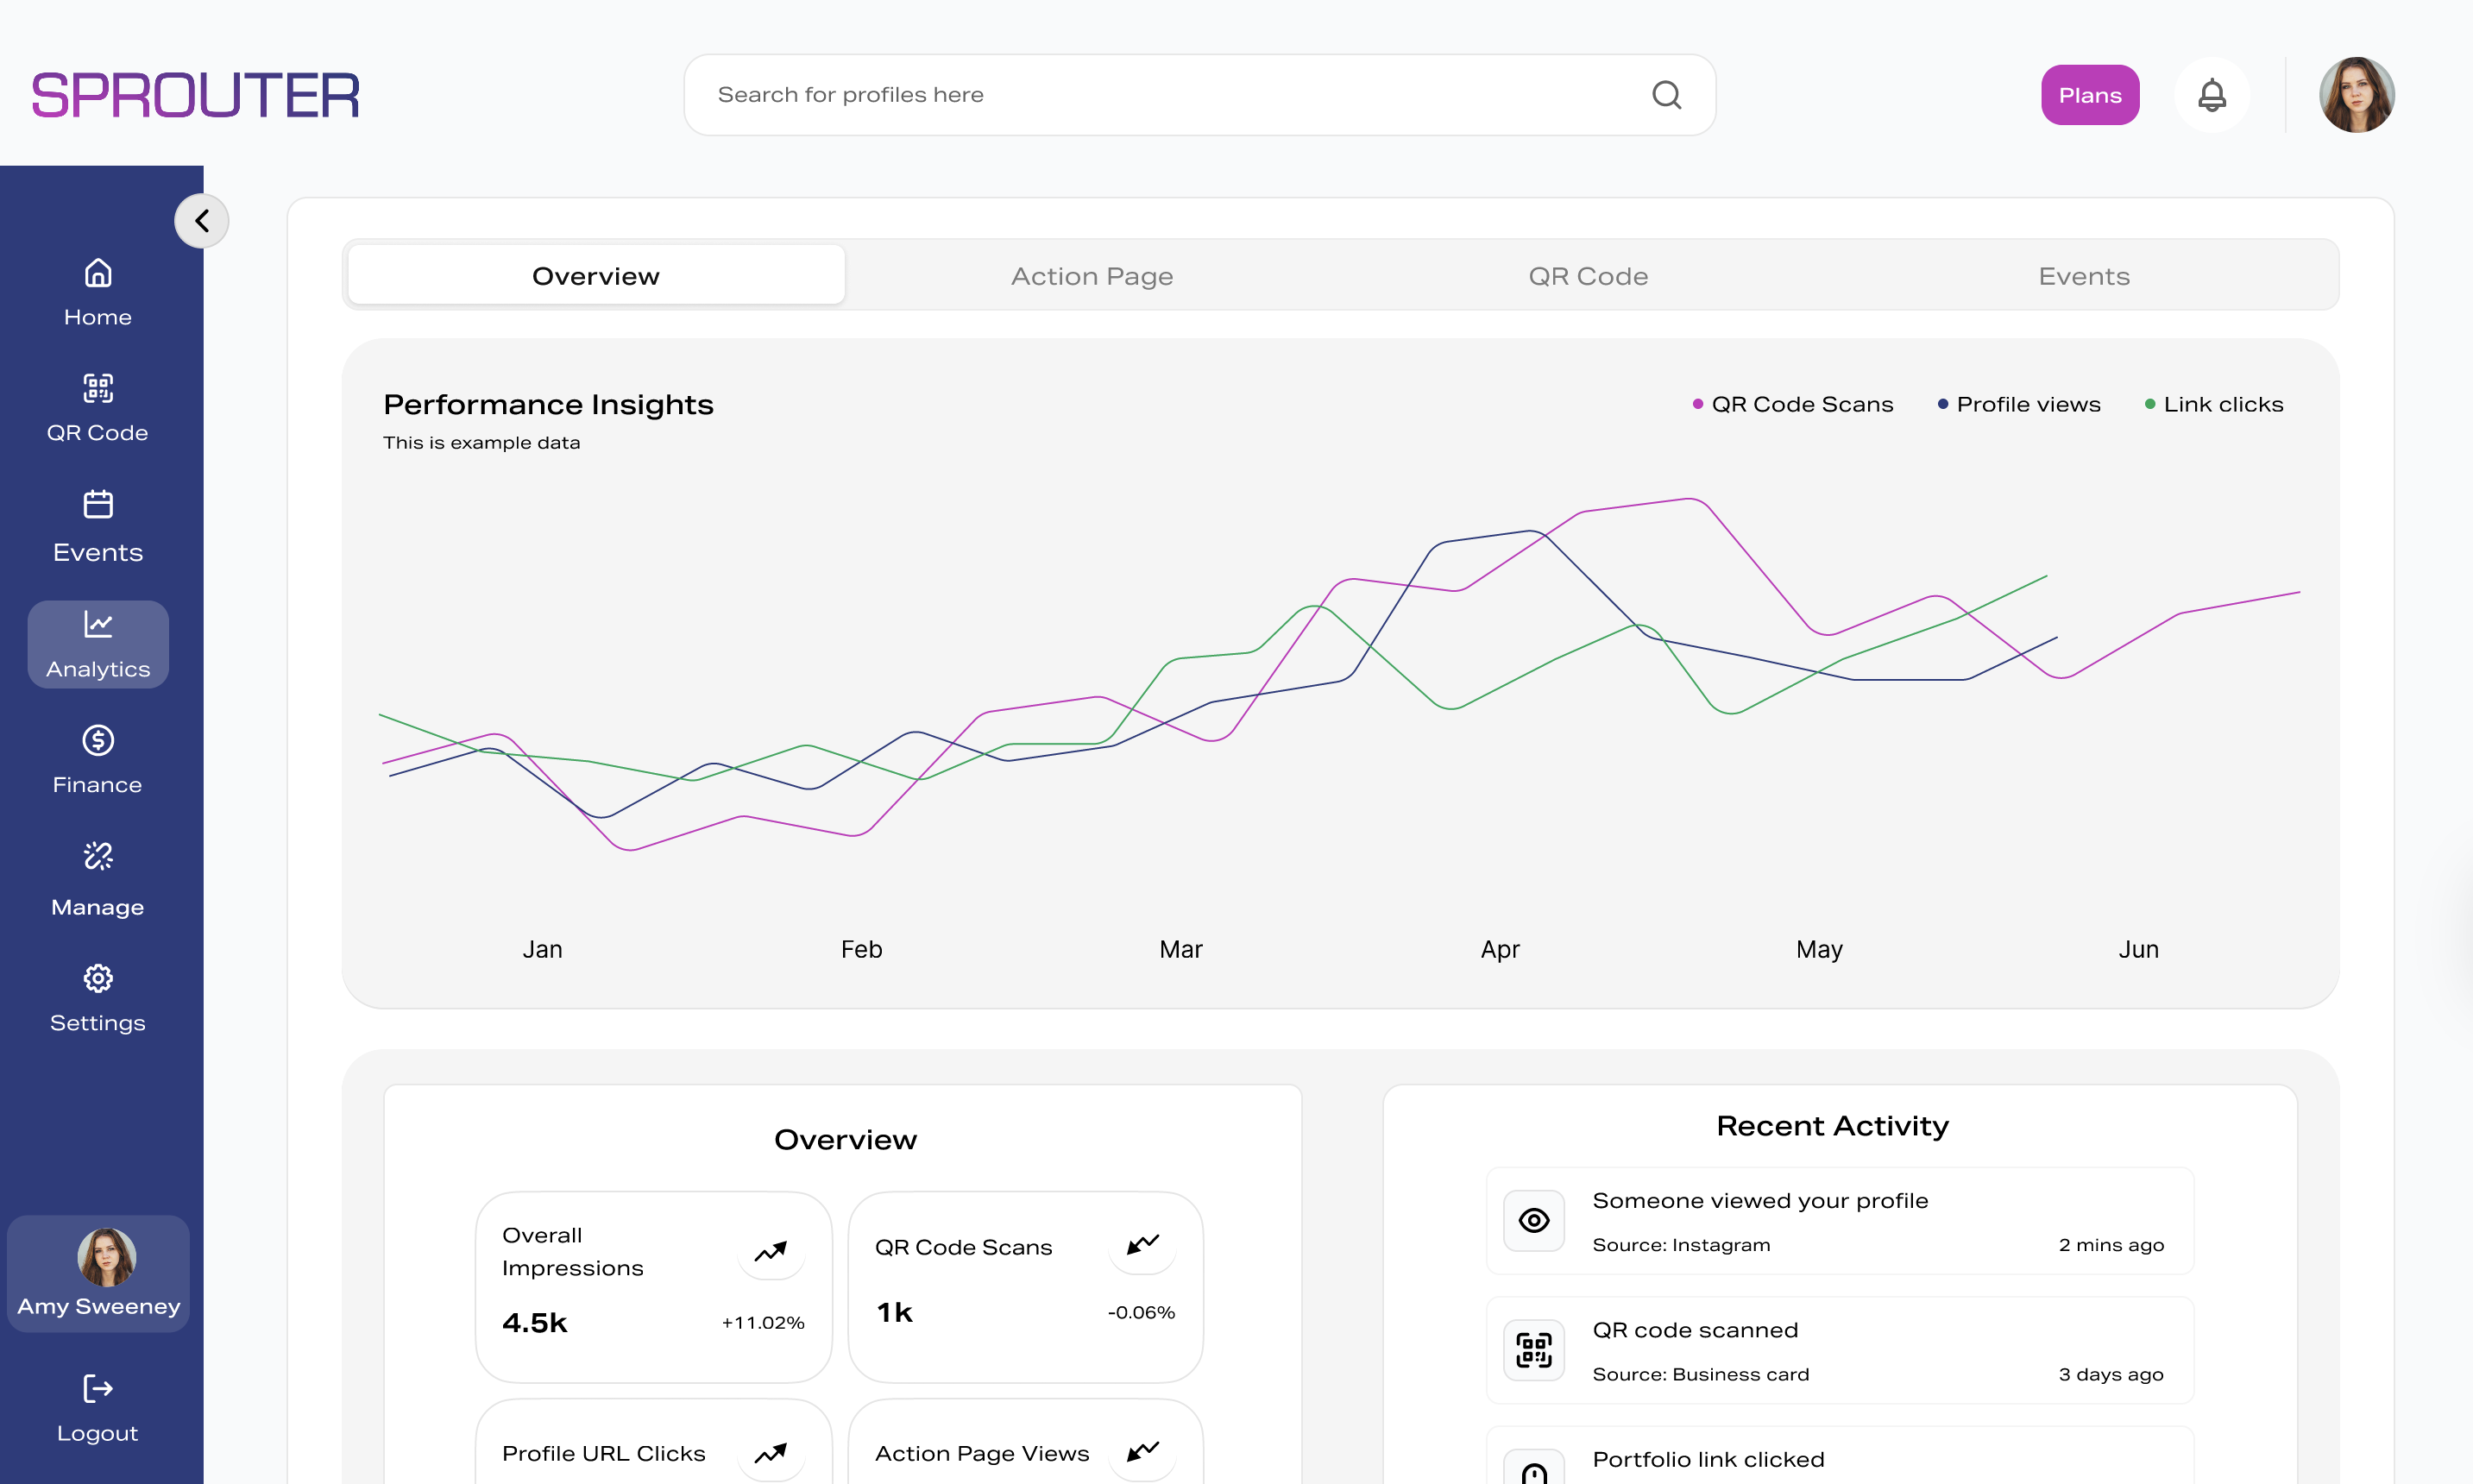
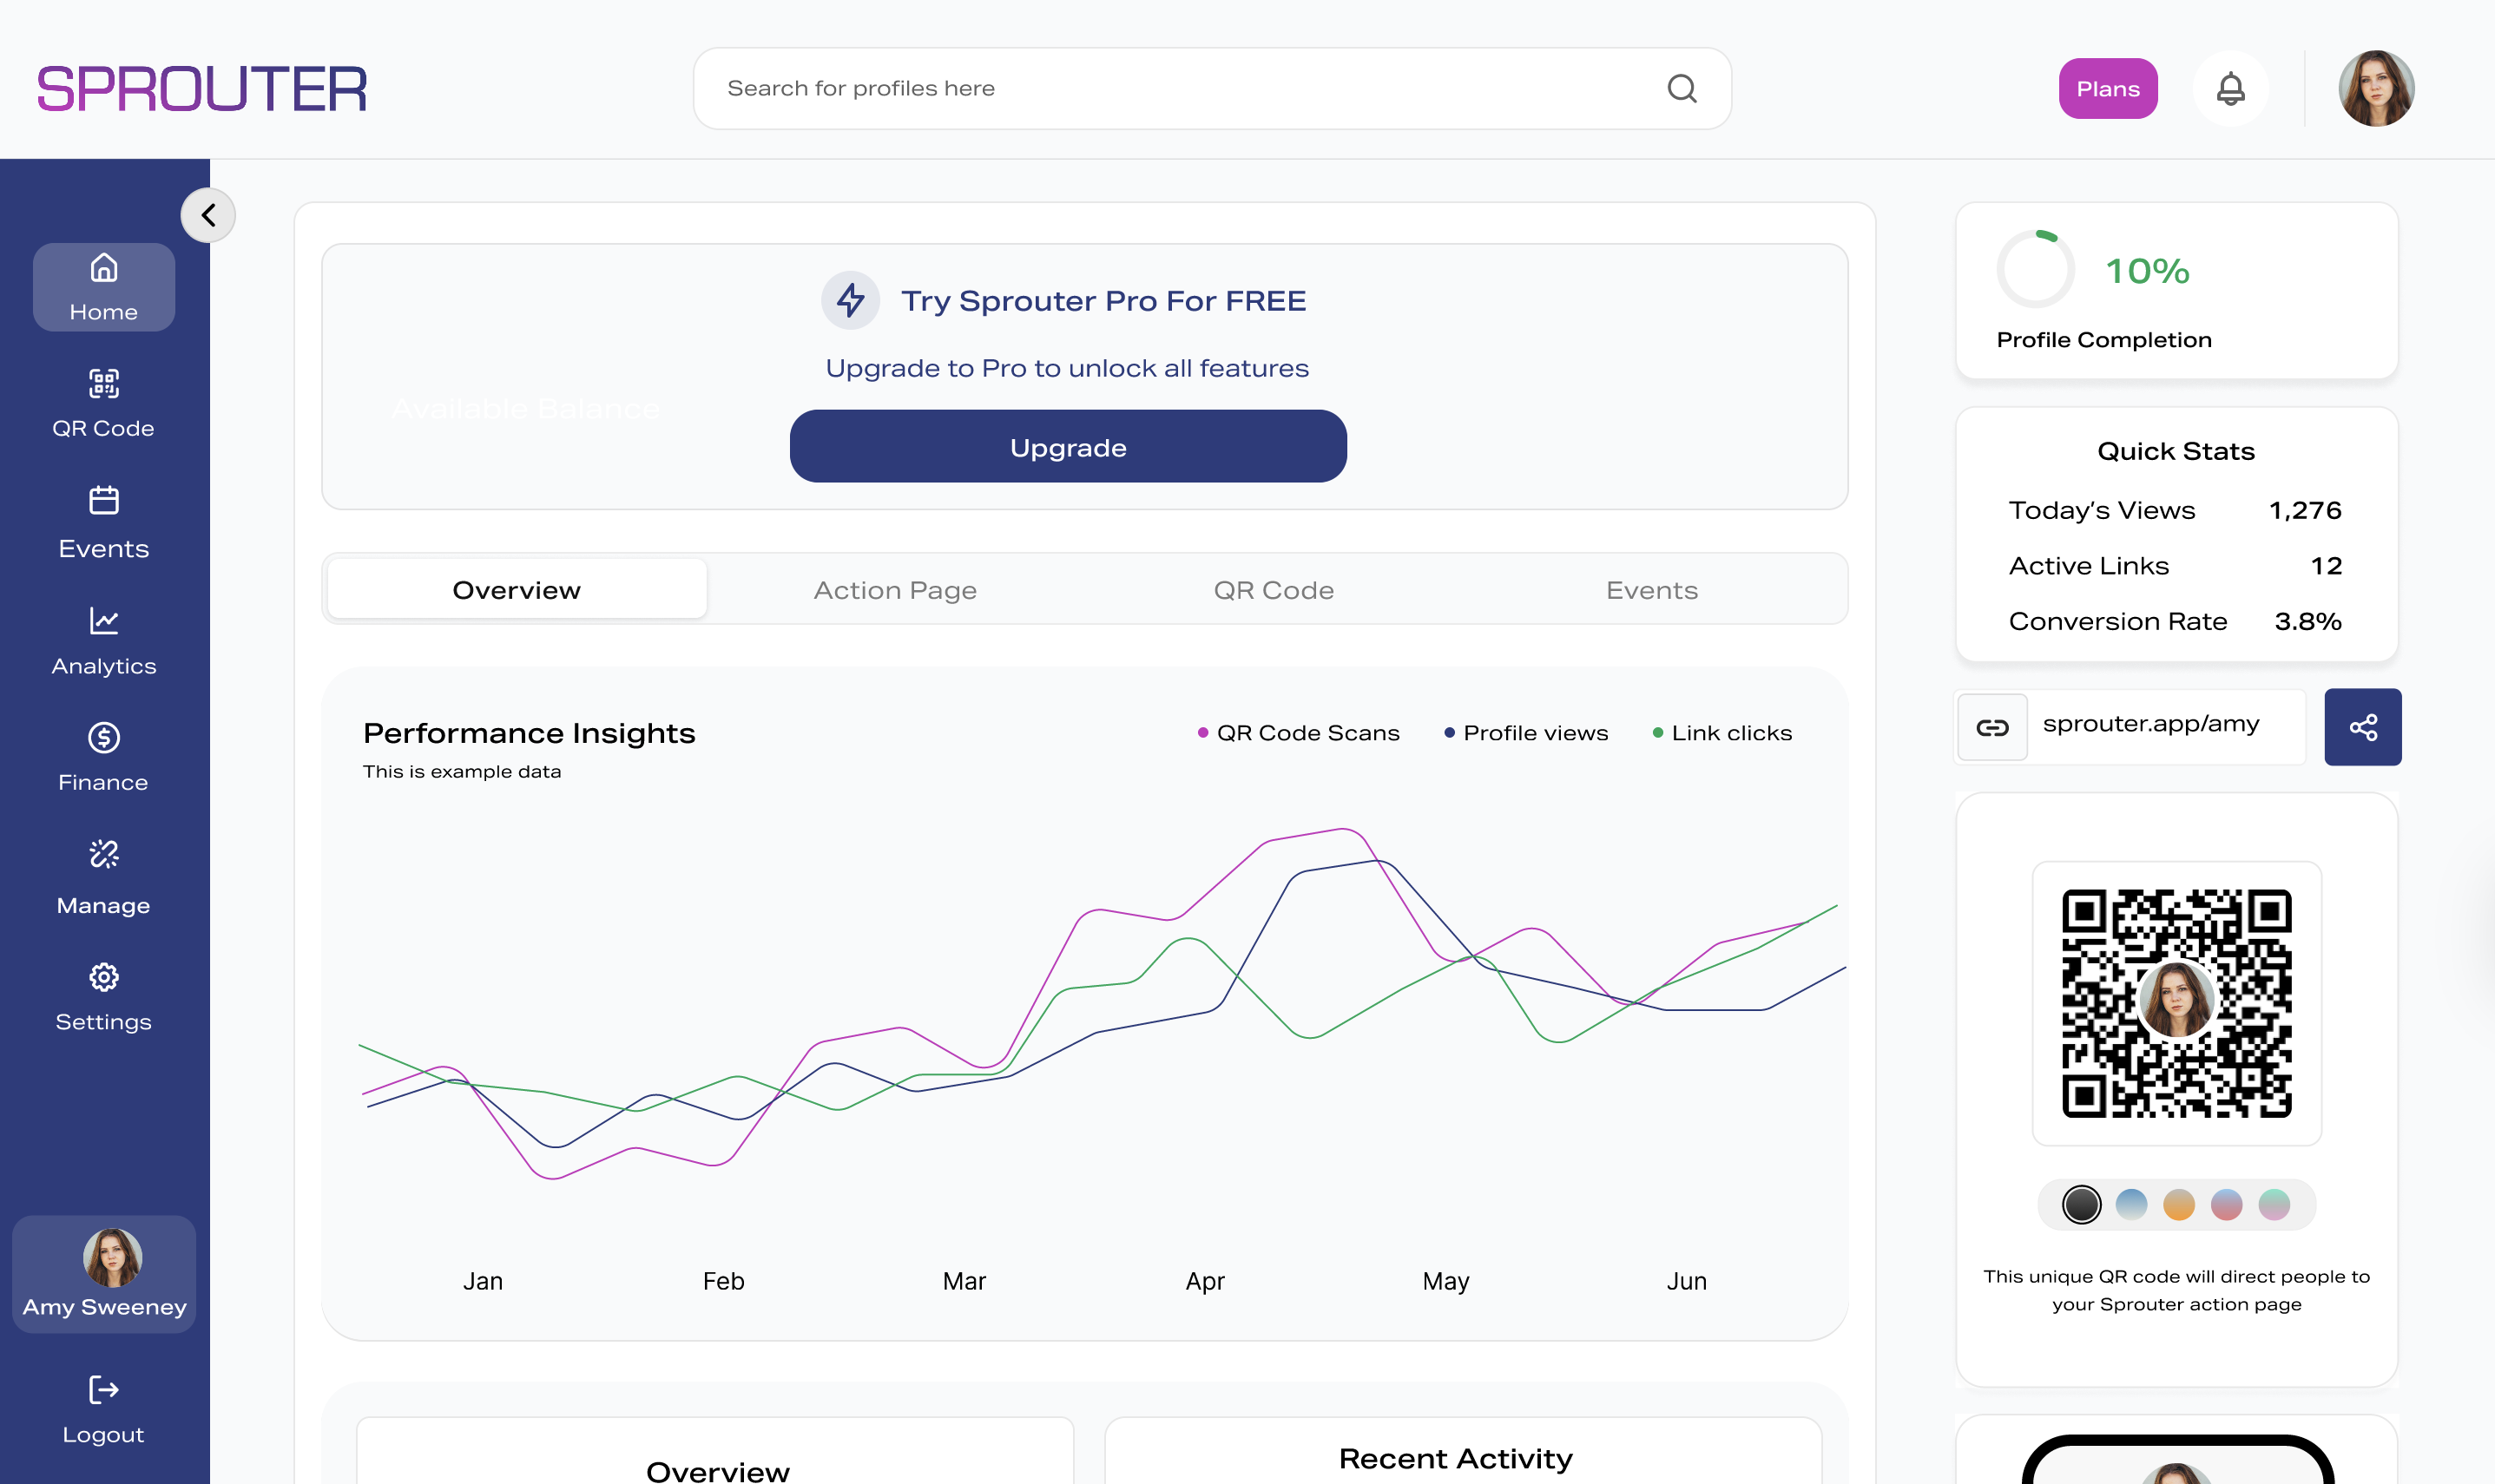
Real-Time Analytics
Track the complete journey from scan to sale. See page views, link clicks, QR scans, and event sales—all unified in one powerful dashboard.
Phoenix #1
Top City68% Mobile
Device SplitThe Four Questions That Matter
Sprouter Analytics is designed to answer the questions that actually drive results.
Reach
How many people found your Sprouter experience?
Engagement
What did they interact with? Clicks, scans, taps?
Context
Where and how did they engage? Device, location, referrer?
Outcomes
Did they convert? Subscribers, tickets, sales?
Three Layers of Insight
From high-level overview to granular drilldowns, get the detail you need.
Action Page Analytics
Understand how your landing page performs and what content drives action.
- Total visitors and views
- Click-through rate (CTR)
- Subscriber conversion rate
- Bounce rate and session duration
- Top links and content performance
- Traffic sources and referrers
- Device and browser breakdown
QR Analytics
Track every scan with location and device context for each QR code.
- Total scans per code
- Scans over time (trends)
- Best and least performing codes
- Geographic heatmaps
- Device breakdown (iOS/Android)
- Time-of-day distribution
- City/state/country breakdown
Event Analytics
Full-funnel event reporting from promotion to check-in.
- Tickets sold and revenue
- Sales velocity over time
- Check-in rate and attendance
- Channel attribution (which QR drove sales)
- Peak arrival times
- Sales by ticket tier
- Post-event reporting
Powerful Analysis Tools
Go beyond surface-level metrics with detailed breakdowns.
Geographic Heatmaps
See exactly where your audience is engaging. Validate distribution, optimize placements, and prove ROI to partners.
- City, state, and country breakdown for every touchpoint
- Visual heatmaps show engagement concentration
- Compare performance across regions and placements
Know Your Audience
Understand how your audience accesses your content so you can optimize for the devices they use most.
- Mobile vs desktop breakdown for all touchpoints
- iOS vs Android distribution for QR scans
- Bot detection to filter non-human traffic
Take Your Data Anywhere
Export charts for presentations, raw data for analysis, and subscriber lists for your marketing tools.
Ready to understand your audience?
Start tracking everything from day one. Free plan includes full analytics for 7 days.